
Is the Ground Still Where the Plans Say It Is? Drone LiDAR Mapping and Valley Subsidence
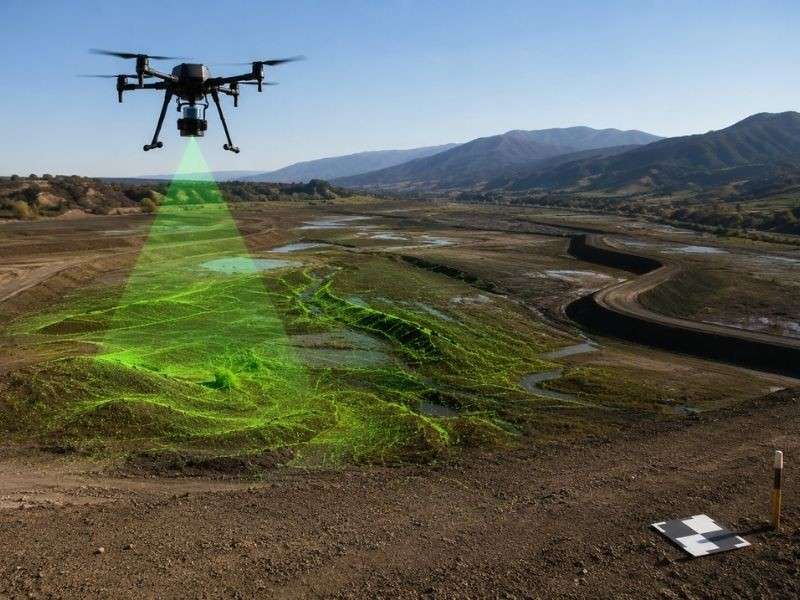
The ground sinks slowly enough to fool everyone. A site graded fifteen years ago may sit noticeably lower today, and nobody standing on it can tell. Drone LiDAR mapping gives project teams a way to answer the question directly by comparing detailed surface models captured over time. The comparison only means something when the survey work behind it holds up, and that is where the real discipline lives.
Establishing a Reference Frame Before Comparing Surface Models
Two surface models can only be compared against something neither of them moved. That something is the reference frame, and building it comes before any flight.
Stable control anchors everything. The surveyor selects control points on ground believed to be outside the settling area, verifies them against the wider geodetic network and documents their values. The vertical datum gets confirmed explicitly, since an elevation difference between datasets means nothing if the datasets used different datums. Coordinate systems, geoid models and processing settings all need to match between the old data and the new, or the comparison measures the processing instead of the ground.
Skipping this step produces beautiful, worthless maps. A difference model built on mismatched references shows change everywhere or nowhere, and both results mislead the people making decisions from them.
Detecting Broad Settlement That Is Difficult to See From Ground Level
The regional settlement hides in plain sight. When an entire area drops together, the fences stay straight, the slabs stay level relative to each other and a site walk reveals nothing. The movement only becomes visible against an outside reference.
Point cloud comparison provides exactly that. A dense surface model from today, different from one from five years ago on the same reference frame, shows the pattern across the whole site at once. Gradual bowls of settlement appear in color where the eye sees flat ground. Elevation trends emerge along pipelines, channels and building rows. The technique measures millions of points, so the broad shape of the movement stands out even when any single point could be questioned.
That broad shape is the value. One benchmark can say a point dropped. A different model says where the dropping starts, where it stops and how the site behaves between them.
Separating Real Movement From Vegetation and Processing Noise
A difference model shows every change between two datasets, and most changes are not ground movement. Trees grew, brush filled in, a stockpile arrived, a shed went up and the processing software made different choices in each dataset. Reading raw differences as settlement produces false alarms everywhere.
Quality work filters the noise before anyone interprets the signal. Ground classification removes vegetation and structures so the comparison uses bare earth only. Control checks confirm each dataset sits correctly on the reference frame. Overlap analysis inside each flight exposes internal inconsistencies, and checkpoints measured on the ground verify the model against independent truth. Only after those steps does a remaining difference deserve to be called movement.
Honest reporting states the detection threshold too. Every method has a noise floor, and claiming to see half an inch of settlement with data accurate to an inch helps nobody.
Translating Surface Change Into Useful Planning Information
A verified movement map earns its keep when engineers act on it. The findings feed directly into practical reviews:
- Drainage behavior, since a few inches of settlement can flatten a designed slope and leave water standing where plans show flow
- Site grading assumptions, which may need updated elevations before the next construction phase
- Surface facilities such as pavement, channels and pads that tolerate limited differential movement
- Monitoring priorities, so instruments and repeat observations concentrate where the map shows the most activity
The surveyor delivers measurements and their limits. Engineers and owners decide what the movement means for foundations, pipelines and future plans, and the clean division of roles keeps everyone inside their expertise.
Creating a Repeatable Record for Long-Term Observation
One comparison shows displacement. A series shows behavior, and behavior is what long-term decisions need. Building the series takes deliberate consistency from the first flight forward.
Each campaign should repeat the essentials. The same control network, checked each time for stability. Similar flight parameters, so point density and accuracy stay comparable. Documented processing settings, complete metadata and a survey report recording equipment, dates, conditions and results. Checkpoints measured on the ground with every flight give each dataset independent verification, and a stated schedule keeps the intervals meaningful.
Records built this way outlive the people who made them. A team reviewing the site in fifteen years can trust the old datasets, add new ones on the same frame and read the full history of the ground. That continuity turns a mapping product into a monitoring program, and it costs little more than doing the first flight properly.
Frequently Asked Questions
How much ground movement can drone LiDAR actually detect?
It depends on the control quality, the sensor and the processing, and the honest answer comes as a stated threshold in the survey report. Differences smaller than the combined uncertainty of the two datasets cannot be called movement, no matter how the map is colored.
Why can’t older aerial mapping just be compared with a new flight?
Sometimes it can, with caution. The older data needs known accuracy, a recoverable reference frame and compatible processing. When those are missing, the comparison inherits every unknown, and the result may show datum differences dressed up as settlement.
Does a different model prove what is causing the ground to sink?
No. It measures where and how much the surface changed between flights. Explaining the cause belongs to geotechnical and groundwater professionals, who use the movement map as one input among several.